A task is a workflow or a single tool execution. Each task initiated in a project has its own task page, which contains information about its status, inputs, and outputs. The task page provides access to the statistics and logs for the tools executed in the task, which can be useful when optimizing a task or debugging one that has failed.
On this page:
To see detailed information about the tools executed in a task:
- Navigate to the project where you executed your task.
- Click the Tasks tab and then click the name of the desired task.
- To open the Task stats page, click View Stats & logs.
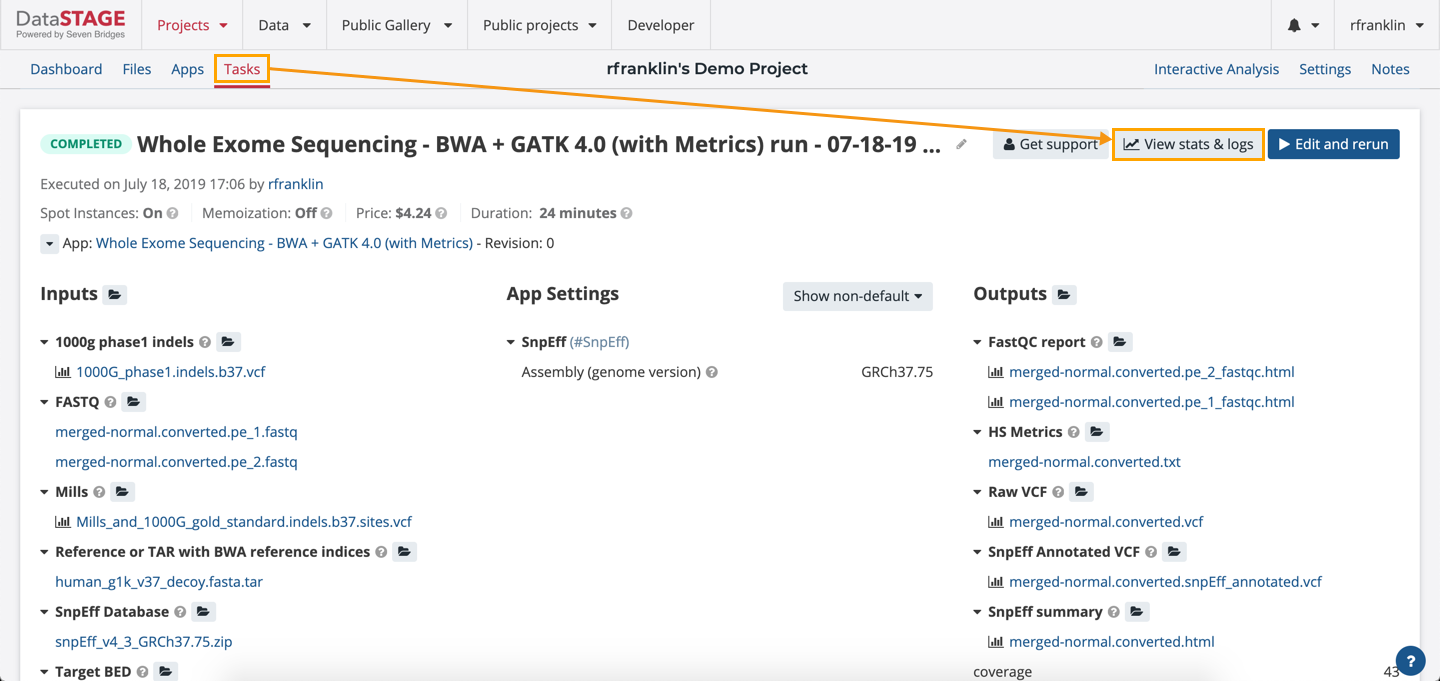
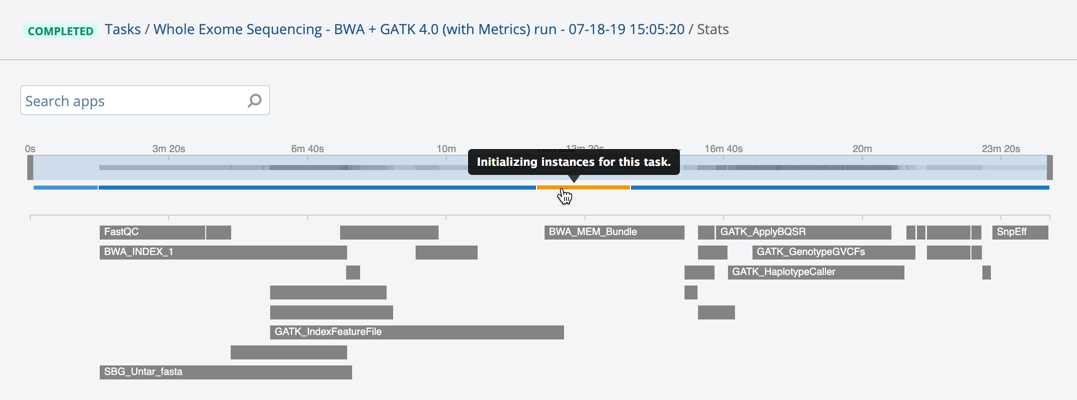
This will bring up the Task stats page, which shows a timeline of the tools executed in the task. Tools are placed along the timeline in the order of their execution. Tools executed in parallel are placed below one another.
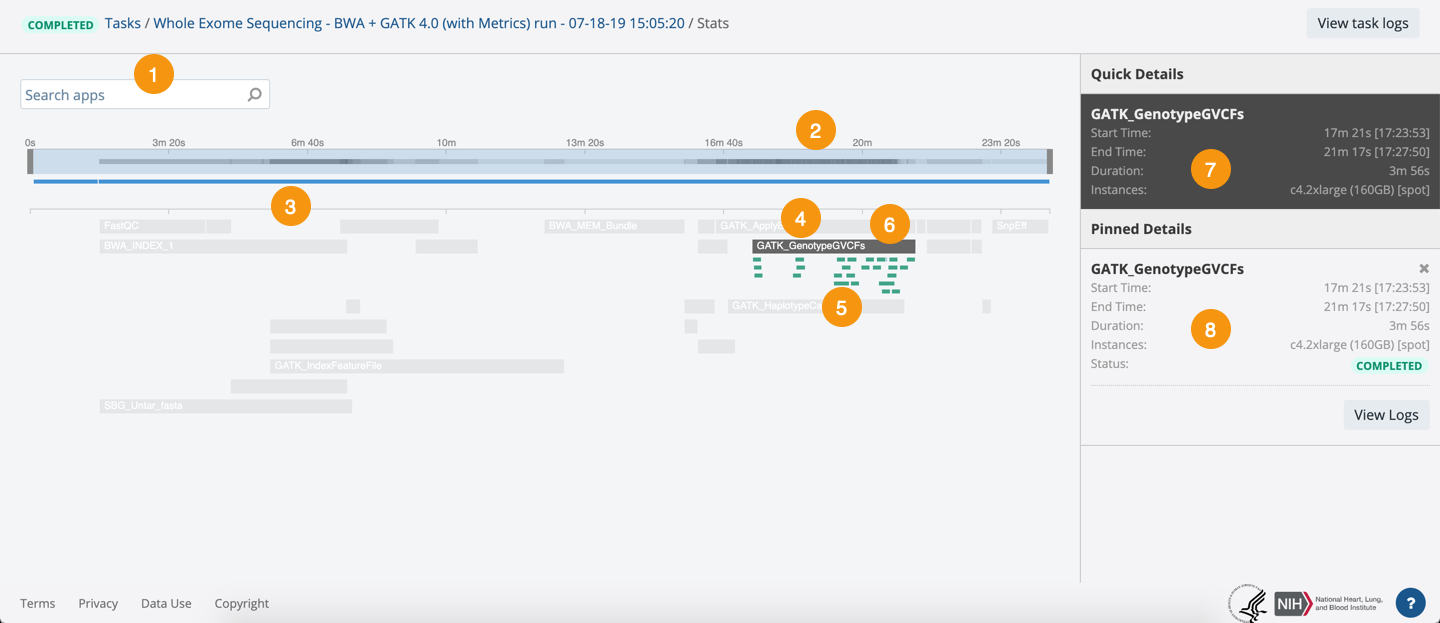
Features of the Task stats page, as labelled in the screenshot below:
- The Search box.
- The context zoom on the timeline has two sliders you can use to select a section for further examination.
- Indicator showing the periods when the task has been queued or running.
- A tool executed in the task (GATK_GenotypeGVCFs in the example below).
- A [job](#tools and jobs) that is part of the tool shown above it.
- Hover over a tool or a job to display its Quick Details in the right panel. Click it to display Pinned Details.
- Quick Details.
- Pinned Details.
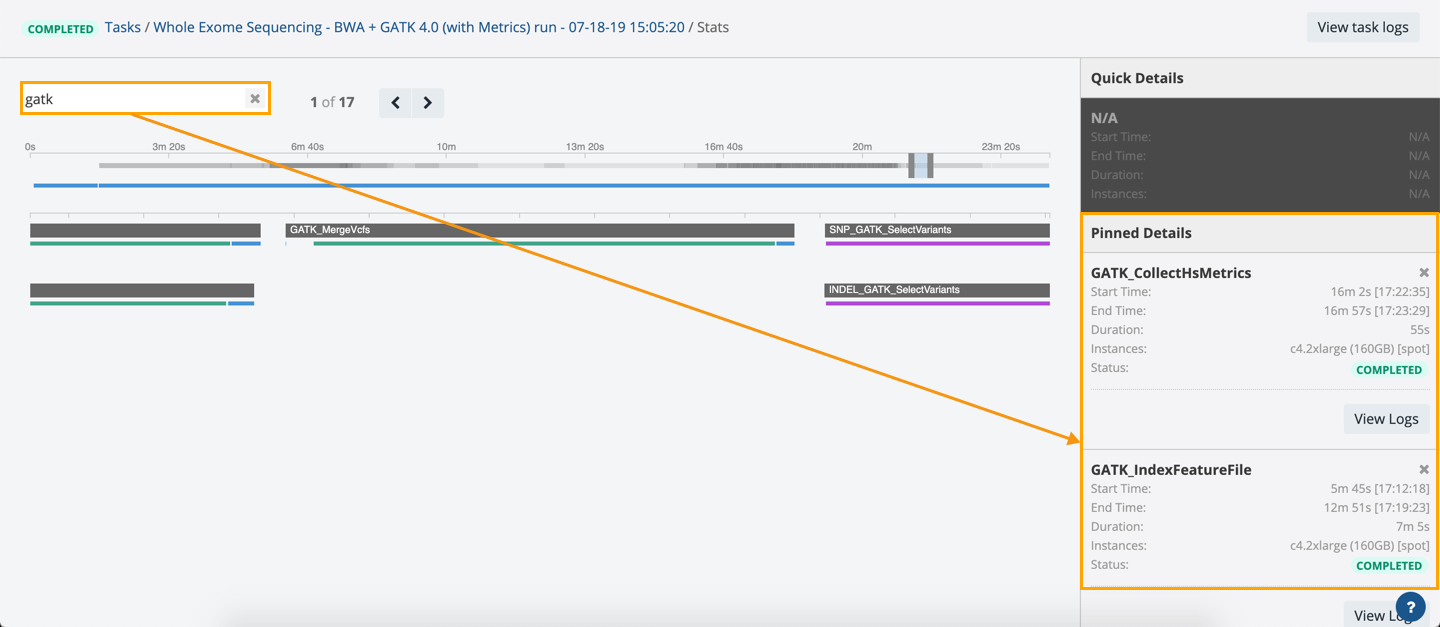
The Search box
The Search option, shown below, enables you to quickly navigate to a specific tool. The details of all tools that match the search criteria are displayed in Pinned Details in the right panel.
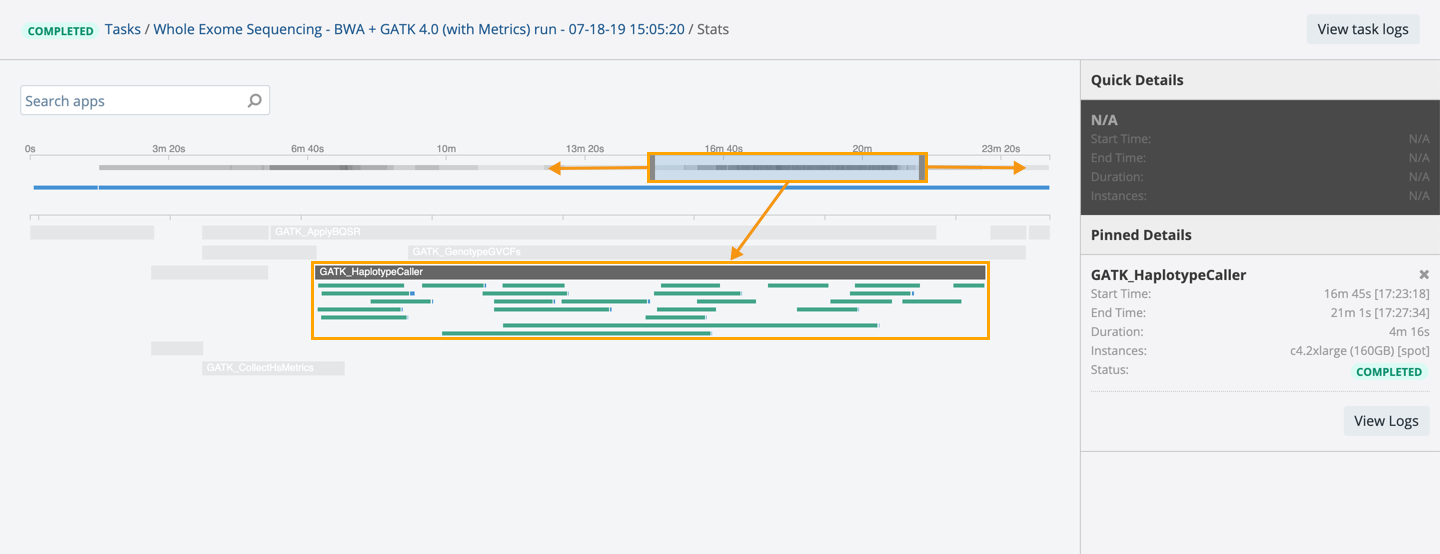
The Context Zoom
The context zoom on the timeline enables you to highlight time periods and zoom in for closer examination. The zoom has two adjustable sliders that allow you to select an area for examination. The topmost horizontal bar on task stats page is a timeline depicting elapsed time. The sliders allow you to zoom into regions of the timeline by expanding or collapsing the area between them.
Below the timeline you will see a line containing blue and orange segments. These segments represent how the task status was changing throughout the execution.
The blue segments indicate when the task was in the RUNNING state, while the orange ones indicate the periods when the task was in the QUEUED state. Hover over any of the segments to see details about the specific task state.
For more information, please refer to the list of task statuses.
Tools and Jobs
A detailed view of the selected area is shown beneath the timeline. Usually, you will see several horizontal bars on the timeline, corresponding to different tools and their jobs. Each tool is executed in several steps, which are called jobs. To view these jobs individually, click the bar representing the tool. The jobs appear as horizontal green bars underneath the tool. Parallel jobs are aligned vertically, to indicate that they executed simultaneously (see the screenshot above).
Tools that execute quickly may not be visible in the zoomed out view of the timeline because they take up only a tiny fraction of the total timeline. If this is the case, find the tool you want to inspect by typing its name in the Search box. The zoom area automatically adjusts to fit the tool you searched for.
Quick Details
Hover over a tool or job to pull up its Quick Details. Details provided include the tool's name, the execution start time, end time, and duration.
Pinned Details
Click on a tool or job to pull up its Pinned Details. Pinned Details shows the same information as Quick Details. However, it also allows you to see details for multiple tools at the same time. Simply click on more than one tool.
There are three types of jobs:
- File download/upload jobs depicted in blue
- Docker pull jobs depicted in purple
- The actual tool execution jobs depicted in green
If the job does not finish successfully, its status will be clearly indicated. The related jobs are color coded red for failed jobs and orange for aborted jobs. Segments in gray indicate job retry.
Updated about 5 years ago
