Estimate and Manage Your Cloud Costs
Microsoft Azure is available on demand. Please contact our support for more information
Overview
In this tutorial, you will learn how cloud costs are incurred on the BioData Catalyst powered by Seven Bridges, and the steps you should take to estimate your project cloud costs in advance of scaling up analyses.
Learning to estimate and manage your cloud costs will prepare you to effectively budget for your research projects. These estimates can be included in grant proposals, or be used to request cloud credits offered by the National Institutes of Health.
Background
The Platform is a multi-cloud bioinformatics solution. This means that you can run compute jobs on regions of Amazon Web Service (AWS) and Google Cloud Platform (GCP) (Figure 1). By running analyses on the cloud in the location where data is stored, it saves you time that would otherwise be spent copying large datasets. This multi-cloud functionality can also lead to cost savings, since data egress charges can be avoided. These concepts will be expanded upon throughout this tutorial.
New Platform users may be accustomed to working with an on-site HPC system or local server. Local systems require a large investment in hardware, software, and maintenance, and these costs may seem invisible on a day-to-day basis. By comparison, cloud computing operates under a “pay as you go” model, where you are charged only for the resources you need, when you need them. This represents a cultural shift for performing computational research. However, by keeping some simple principles in mind, you can easily estimate and manage your cloud costs.
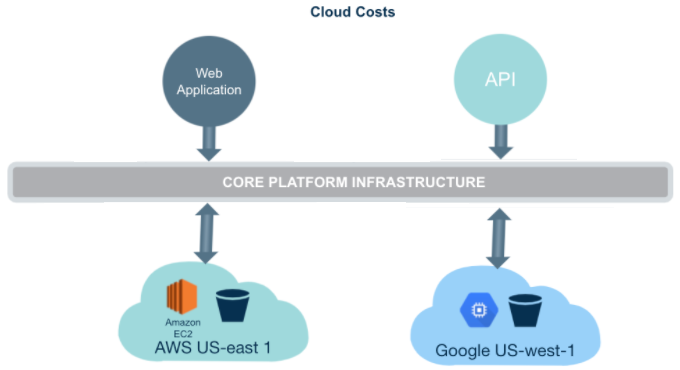
Figure 1. Platform is a multi-cloud Platform where the cloud costs are passed directly to users.
One significant advantage of using the Platform for your computational research is that you can leverage existing datasets that are hosted in the cloud. Platform hosts the rich The Cancer Genome Atlas (TCGA) dataset.
Hosted data is stored in the cloud and is made available to users on the Platform based on data access controls. This means that users can access the hosted data and run analyses on it without the need to spend time and resources downloading large datasets, or pay for storage costs.
What will incur costs?
When estimating the cost of using the Platform, there are two types of costs to keep in mind:
- data storage, including inputs, outputs, intermediate files, and transfer of data;
- computational costs of the analysis. Both types of costs will be explored in more detail below.
Data Storage
Storage costs are incurred by the user when files are stored on the Platform. Users can upload/import data to the Platform using several mechanisms (see documentation on Uploading Data). Once the data is uploaded, data storage becomes an ongoing cost.
The primary sources of storage costs include:
-
Your own data - Data uploaded to projects on the Platform through the GUI, API, or Seven Bridges Command Line Interface (CLI) are housed in storage buckets (AWS S3 or GCS) based on the cloud region assigned to a project at its creation.
Example: A researcher uploads sequencing data in the form of
.fastqfiles to the Platform. -
Workflow output data - Files generated by running an analysis on uploaded or hosted data will incur storage costs. Running a workflow or tool on hosted data generates a derived file. This file derived from a hosted dataset will accrue storage costs the same way an uploaded file, or a file derived from an uploaded file, would. Example: You run a fastqc workflow on .fastq data uploaded to your project. The output .html report and .zip files from the workflow accrues storage costs in addition to the input .fastq file.
Example: You merge two hosted .vcf files from a hosted study into a single, larger, .vcf file using bcftools merge. Only the output .vcf file accrues storage costs since the input vcf files were from hosted studies.
Note: Transferring data out of the cloud incurs data egress charges set by the cloud provider. AWS or Google Cloud, all charge for data egress and publish this information online.
Computational jobs
The second major source of cloud costs on the Platform is computational jobs. Computational jobs on the Platform are executed using the compute instances on AWS or GCP. Compute instances provide a defined model and number of CPU cores and memory (RAM) on which to execute a computational job. Pricing for instances is set by the cloud provider.
The following costs are relevant to computational jobs:
-
Workflow instance pricing - Instances used to run workflows or tools are charged according to the type of instance and run-time of the job. Tools within a workflow may run on different instance types. Default instance types may also be overridden if a given computational job requires more resources.
Example: When running a variant calling workflow, different instance types are used for alignment and variant calling steps. The cost passed onto users is the total cost for the time spent on each instance.
-
Interactive Notebook (Data Studio) instance pricing - The Platform offers Jupyterlab Notebooks, RStudio, and SAS as part of the Data Studio feature. These environments enable users to perform iterative, interactive, and data visualization tasks on the cloud where their data is already located. Each environment has a default instance type set for launching a notebook; however, users can customize the instance type if they require more CPUs or memory. Data Studio instances are billed by the type of instance and the time used.
Example: After running various workflows, you want to both explore the dataset and generate summary figures using R or Python in an interactive notebook. The cost passed on to you is the total cost for time spent on each instance.
Note: A minor component of the computational costs passed on to users is the storage of temporary files on compute instances. These temporary runtime files are not saved to the user’s project at the completion of a computational job. These temporary storage costs, often a minor fraction of the compute costs for a given job, are included in the cost for the computational job and may be queried using the Seven Bridges API through the R or Python libraries.
Steps to estimate cloud costs
Estimating your storage and compute costs begins with understanding your data. The section below provides guidance on how to estimate compute costs for Common Workflow Language (CWL) tools and workflows offered on the Platform, as well as for user-created custom CWL tools.
This section also explains how to estimate costs when working in interactive notebooks, and how to estimate storage costs. Examples are provided for all scenarios.
Understand your data
The first step to estimate your analysis and storage costs is to understand your data by answering the following questions:
Where is your data located?
Is your data hosted, or will it be uploaded to the Platform? This has consequences for how much you should expect for storage costs.
How big is your data?
The size of data can vary dramatically depending on many factors, including what type of files they are. It is important to remember that using an “average” file size means that some files will be larger or smaller than that average, and this variation can be significant. We recommend understanding the range of data sizes, and how many files there are, in addition to the average size for both your input and output data files.
How long will your data be stored on the Platform?
Some files, like workflow outputs that are very time-consuming, are potentially expensive to regenerate, and may be important to store on the Platform for a long period of time. However, if a file is quick and/or inexpensive to regenerate, or if it is a raw data file that can be easily reacquired from its source, it may be reasonable to delete it rather than store it. The costs of regenerating a file are often less than the costs of storage in cloud computing.
By thoroughly understanding the types of data you plan on analyzing, you can eliminate many sources of uncertainty.
Estimate tool/workflow costs
Running CWL tools and workflows are one of the main sources of costs on the BDC-SEVEN BRIDGES, and it is relatively straightforward to estimate the cost for these computational jobs. How we recommend doing this varies depending on whether you use pre-configured CWL apps from the Public Apps Gallery, or custom developed CWL workflows and tools.
Benchmarking for tools and workflows from the Public Apps Gallery
The BDC-SEVEN BRIDGES Public Apps Gallery hosts hundreds of popular bioinformatics tools. Each tool and workflow includes a detailed description and benchmarking information for time, computation, and cost.
This benchmarking information can be used to estimate your anticipated costs for using that tool or a similar custom tool. To estimate costs, we recommend plotting the run-time and/or cost compared to the input file size.
This will also enable you to see whether or not the runtime or cost of the tool scales linearly. We suggest rounding your estimates up by a minimum of 30% over the calculated cost to anticipate any issues that should arise, rerunning with different settings, unexpected workflow failures due to problems with the input files, etc.
For accurate estimations, we recommend running a representative set of files you plan to use for analysis, then extrapolating the costs from the results.

Figure 2. Benchmarking information from the RNA-seq alignment - STAR 2.5.4b workflow.
Example: You plan to run the STAR RNAseq alignment workflow on 4 samples to assay highly-expressed genes, each of the samples are paired-end. Each file is roughly 4 GB in size, which is nearly the middle scenario detailed in the benchmarking information in Figure 2 above. This adds up to $0.60 x 4 = $2.40. We recommend planning for unforeseen problems (like failed Task runs), and adding an additional 30%, totaling $3.12.
When extrapolating beyond the bounds of the benchmarking information it is important to understand whether the particular app scales linearly. For apps that scale linearly, plotting the benchmarking information and fitting a line to the data will provide a reasonable estimate of the run cost. Note that these benchmarks hold true for the instance types provided in the benchmarking table. If the user changes the instance type, then these benchmarks will no longer be accurate.
Benchmarking apps on your data
While benchmarking information available on the BDC-SEVEN BRIDGES is a helpful budgeting tool, we recommend testing with your actual data. This is necessary when bringing your own CWL apps to the BDC-SEVEN BRIDGES, and when running apps from the Public Apps Gallery that lack sufficient benchmarking information. In this situation we recommend the following:
-
Pick a representative but small subset of files - in addition to picking a small subset, make sure that it captures the range of input file sizes seen in the real set of files. If your input files vary dramatically in size, you want to make sure that you don’t ignore this fact and underestimate the cost to run the full set.
-
Run this subset of analyses to create your own benchmarking information for your tool - After running, use the cost monitoring tools detailed in earlier sections to summarize the cost of this smaller set of files.
-
Scale up the cost to the larger full set of files you wish to run - Example: You have 40 pairs of whole-genome bisulfite sequencing fastq files to process using a CWL workflow. The files vary in size from 2 GB to 40 GB, distributed around an average of 20 GB. You select a subset of 5 pairs of fastqs that have a similar range of sizes and the same average size. You then run the workflow on these samples. The average cost of the tasks was $50. Using the average task price you then scale up to the remaining 35 tasks with $1,750 in expected workflow execution costs. To account for unexpected errors or issues that might arise, we recommend adding a 30% buffer and budgeting a total of $2,275.
Estimate Data Studio interactive notebook costs
Data Studio is an interactive analysis tool, bringing Jupyter, RStudio, and SAS to the Seven Bridges cloud Platform. Calculating costs for running an interactive notebook in Data Studio depends only on the instance type and time spent in the environment to perform your analysis.
Example: You have prototyped an analysis locally and determined that the default AWS c5.2xlarge instance will suit your needs. The current pricing for this instance is $0.48 per hour and you expect to explore this dataset for approximately 3 hours. This will incur $1.44 in expenses, which we will increase to $1.88 to account for unexpected findings which make your analysis take extra time.
Note: Data Studio sessions can be set-up to continue running even if your web browser is no longer viewing the page. While this is useful for long-running analyses, it will continue accruing costs until the Data Studio session is closed. For this reason, the default settings for Data Studio include a time-out. Be careful to make sure you end an analysis when desired if you disable this feature.
Estimate Storage Costs
Storage is an ongoing cost. This means that monthly storage costs will be charged to the billing group associated with a given project housing the files in question. Hosted data does not incur charges, but files derived from hosted data do. If files are copied between multiple projects, you are only charged once for each file, as long as the projects are a part of the same billing group.
The best way to understand how much data is stored in a project is to export a manifest from the Files tab and calculate the cumulative file size. Please note whether you have duplicated data in your project since this could result in overestimation.
Example: You have 5 TB of derived data stored in a project with the location set to AWS-us-east-1. Seven Bridges data incurs $0.021 per GB per month in storage costs for the AWS-us-east-1 cloud location. Therefore, you would expect 5000 GB x $0.021 = $105 to be your monthly storage price.
Best practices for efficient cloud computing
By following some simple best practices you can reduce your cloud costs, sometimes dramatically.
Tools and Workflows
Efficient workflow design
-
Re-use rather than re-compute intermediate files - In certain situations, it makes sense to create multiple versions of workflows that allow starting from an intermediate step. This allows you to avoid repeating computationally-intensive steps in an analysis to do a different downstream processing step.
Example: You have a complex whole-exome sequencing workflow. There are several steps run to call variants on an input .bam file after read alignment to the reference genome. There are also quality control checks to perform on the .bam file. It makes sense to split up the workflow: one workflow to perform read alignment, outputting a .bam file and any QC metrics you wish to use, and another workflow to perform the downstream variant calling steps. This is more efficient than repeating the alignment step again to call the variants. -
Use appropriate instance types - the BDC-SEVEN BRIDGES allows you to choose instance types for each step in a workflow, as well as override the default options. If you understand the size of data you are working with, you may be able to reduce the price by choosing a cheaper instance. Likewise, you don’t need to select larger instances with features (GPUs for example) or storage in excess of what you need.

Figure 3. Selecting a custom instance will change the price that you are charged for running a workflow.
-
Use multithreading options where available - Many tools within workflows have options for multithreading. It is usually advisable to saturate the available CPU cores/threads on a given instance. This will reduce the run-time, and therefore price, of your job.
-
Use scattering and batching - Batching will enable you to group workflow runs over a large number of input files based on the files themselves, or a metadata field that is associated with that file. This optimizes your workflows for run-time, enabling many workflow runs to be carried out simultaneously, without needing to manually click through the job submission page multiple times.
Scattering is configured within the CWL of the workflow itself. A tool is passed a list of inputs on one port, and one job will be created on the same instance for each input in the list. This helps saturate the available resources on an instance, making sure you are taking advantage of all the compute power that you are paying for.
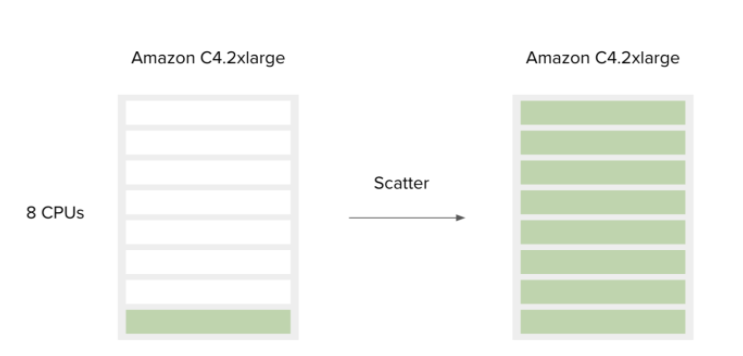
Figure 4. Scattering a workflow saturates available CPU cores on this AWS instance.
-
Use preemptible instances - By default, instances use on-demand pricing. However, they can also be configured to use “spot” instances. These are preemptible based on bid price and demand. Their pricing does fluctuate, however, it is typically much cheaper than on-demand pricing. There is very little downside to using them on the BDC-SEVEN BRIDGES, as there is a built-in retry mechanism. If your job or a portion of your workflow) is interrupted, it will be retried at on-demand pricing.
-
Turn on memoization - Memoization allows you to reuse pre-computed inputs to workflow steps. This is relevant if you are running a long workflow and it fails due to a step late in the workflow. In this situation, if memoization is turned on the workflow would restart from the point at which it failed, using the intercreatemediate files saved to the instance, potentially saves money and time.
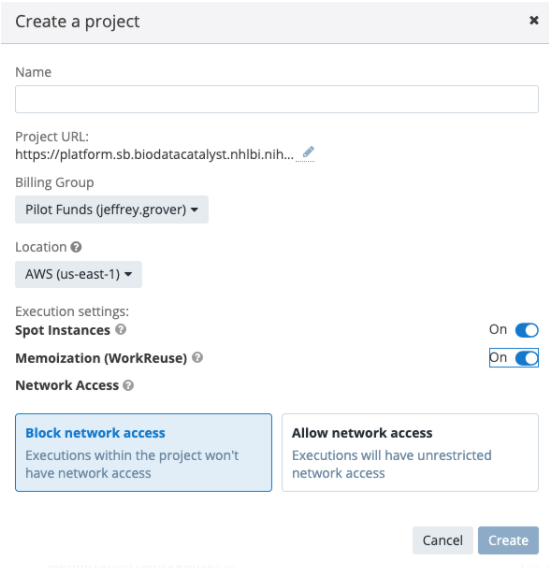
Figure 5. Spot instances and memoization can be turned on from the project creation dialog. They are also configurable per task, or within the project settings after creation.
Data Studio interactive analysis
Data Studio is best used for quick, interactive work, such as when you want to explore a dataset, create a visualization, or prototype workflows. Spot instances are not available in Data Studio due to their interactive nature.
Select an appropriate instance type
As with workflow tasks, Data Studio costs will heavily depend on the instance type that you select at task creation. This is able to be selected from the task creation dialog.
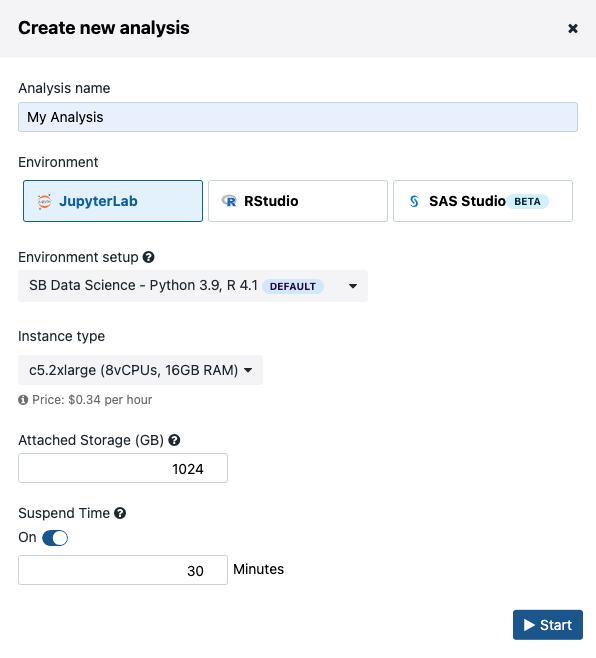
Figure 6. Data Studio instance type selection.
Keep the suspend timer turned on
The suspend time feature keeps your task from running over an extended period unexpectedly. Without it, the instance will continue running until it is shut down by a user, even if your browser closes (it is running on a cloud instance hosted by AWS or GCP).
Consider porting repeated tasks to CWL workflows
While a one-off analysis in Data Studio with interactive visualizations can be a great way to understand and explore your data, this can become limiting if you are running the same tasks many times. Due to the lack of spot instance availability with interactive analysis, it makes sense to turn commonly performed tasks into workflows described with CWL.
Storage
While straightforward to calculate, storage can add up to a large expense. This is especially true when you run several tasks and output files begin to grow within your projects.
- Delete unused files or ones which are cheap to regenerate - Rather than saving everything, when it is safe to delete a file, whether that is because it is no longer needed or is cheap to generate again through a workflow or tool, delete it.
- Use compressed files when possible - Many common file formats have a compressed variant. Or they can be compressed into a .zip or .gz file. Common examples include .fastq.gz (vs .fastq), .bam (vs .sam), or .bcf (.vcf).
- Remember where your data is located - While multiple copies of the same file do not incur additional charges, this also means that you will continue being charged for a file until every copy of it in various projects is deleted.
- Use Volumes to bring data to the BDC-SEVEN BRIDGES - Users can avoid being charged for storage by the Platform if their data is already hosted on AWS S3 or Google Cloud Storage and they connect that existing storage using the Volumes feature. In this situation, users would pay AWS or Google Cloud Platform directly. This can be useful to avoid being charged again for data already hosted on one of those cloud platforms.
Cost tracking on the BDC-SEVEN BRIDGES
The BDC-SEVEN BRIDGES enables you to monitor your cloud costs at the level of individual analyses (tasks), projects, and billing groups. Each will be explained in more detail below.
Cost monitoring at the task level
The BDC-SEVEN BRIDGES shows the cost incurred by all tasks (workflows and tools) which are finished running, whether these tasks completed successfully or ended with an error. The Task summary pages remain indefinitely within the project including the cost information.
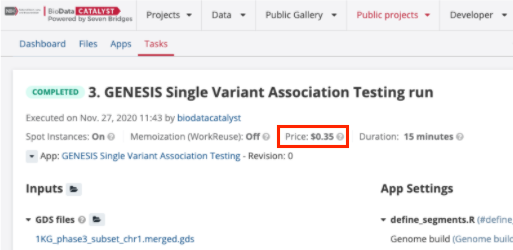
Figure 7. The Task price is shown in the top section of the Task page
Cost monitoring at the project and billing group levels
To see more detailed cost summaries, you can navigate to the Payments page by clicking on your user name on the top right corner of the interface.
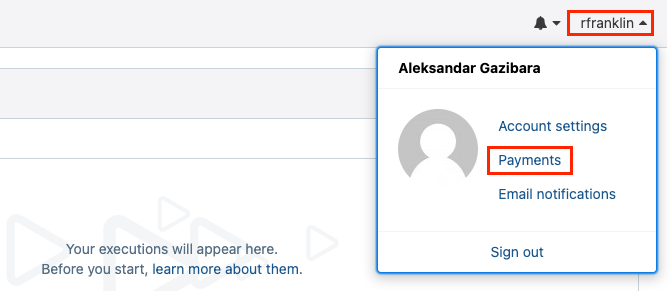
Figure 8. Finding the Payments page.
The Payments page shows the billing groups of which you are currently a member. All users start off with a Pilot Funds billing group.
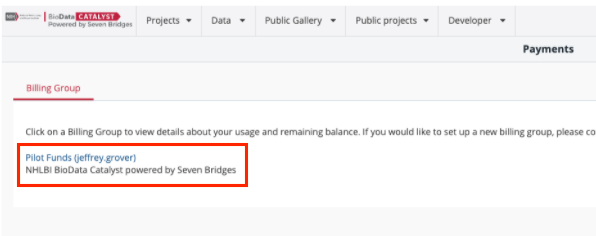
Figure 9. The Payments page lists the billing groups that the current user account has access to
Clicking on the name of the billing group opens the Current Usage page. Here, the breakdown of computational jobs vs storage costs, and the total amount of funds remaining for a billing group are summarized.
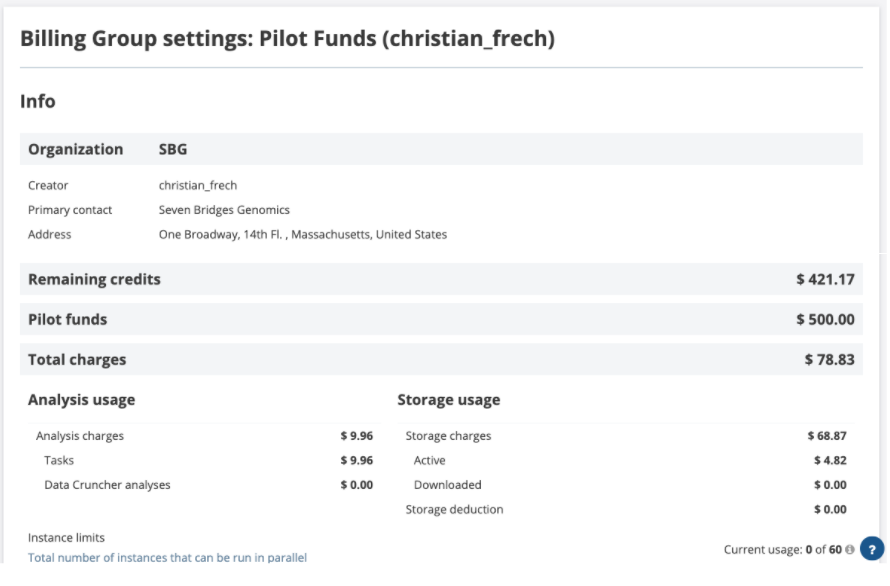
Figure 10. The Current Usage page gives users a snapshot of available funds, charges for completed computational jobs, and total storage costs charged to a particular billing group.
Clicking on the Spending Details on the left side of the interface provides a breakdown of these charges at a per-project level. Using this information a user can clearly see which projects are responsible for large amounts of charges and projects which have negligible impact on their costs.
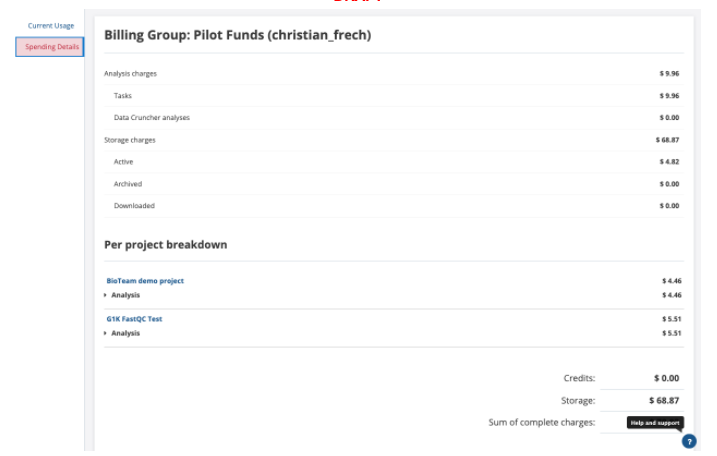
Using all of these built-in cost monitoring options allows you to understand your analysis and storage costs. If you have been awarded cloud credits, these pages also help you understand your costs relative to how many credits you have remaining in your billing group. This is helpful in budgeting, and prioritizing which projects and billing groups to utilize for ongoing analyses.
Funding your computational research
There are several options to provide funding information to cover your cloud costs. We aim for transparency in pricing, allowing you to directly see any costs passed to you, we also aim for transparency in billing and making it easy to track these costs. Several funding mechanisms are available and described in more detail below.
Pilot funds
As a new user, you will receive $500 in credits for use on the BDC-SEVEN BRIDGES. The $500 credit allows you to use all the features of the BDC-SEVEN BRIDGES: you can create any number of projects, collaborate with as many people as you'd like, and execute full data analyses. You may request these funds by filling out the form at BioData Catalyst - NHLBI BDC Pilot Funding Program .
Budget for cloud costs in your grant
Researchers who plan to work on cloud platforms should budget for cloud costs as part of their research proposals. We recommend writing a budget justification that provides information about anticipated storage and compute costs, with expected costs for the various kinds of analyses that will be performed.
Payment options
Individual users or labs can pay for their own cloud costs. Users can pre-pay for anticipated cloud costs or elect to “pay-as-you-go” and be billed on a monthly basis. To set up a billing group, contact [email protected].
Payments can be made by check, wire transfer, or credit card. Seven Bridges will create your billing group after you provide a point of contact for billing and their contact information; a title for the billing group; and your preferred payment method. If your organization needs a purchase order number on the invoice, please provide this as well.
To summarize
By keeping these principles in mind you can effectively estimate, budget for your analyses, and avoid any billing surprises. We welcome you to contact [email protected] if you have further questions about funding your research projects.
Updated 3 months ago
