Annotation Explorer
Overview
Annotation Explorer enables you to interactively explore, query, and study characteristics of an inventory of annotations obtained using Whole Genome Sequence Annotator software.
This application can be used pre-association testing, to interactively explore aggregation and filtering strategies for variants based on annotations. It can also be used post-association testing to explore annotations associated with set variants, say for example, variant sets found significant during association testing.
Currently, annotations for TOPMed Freeze8 variants and Genome wide annotations are integrated with the Annotation Explorer.
Researchers who are approved to access one or more of the TOPMed studies with Freeze8 variant data will have the ability to access the Freeze8 annotation data in the Annotation Explorer. Researchers without access to TOPMed studies can try out the Annotation Explorer with the open access Genome wide annotations for all combinations of SNVs, including each position in the genome as well as INDELs submitted to dbSNP.
Access the Annotation Explorer
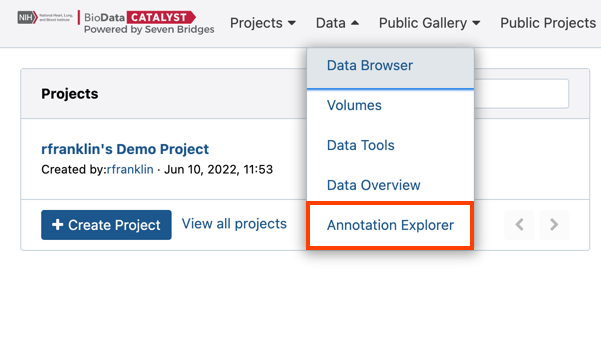
- On the main menu bar, select Data > Annotation Explorer. Dataset selection screen opens.
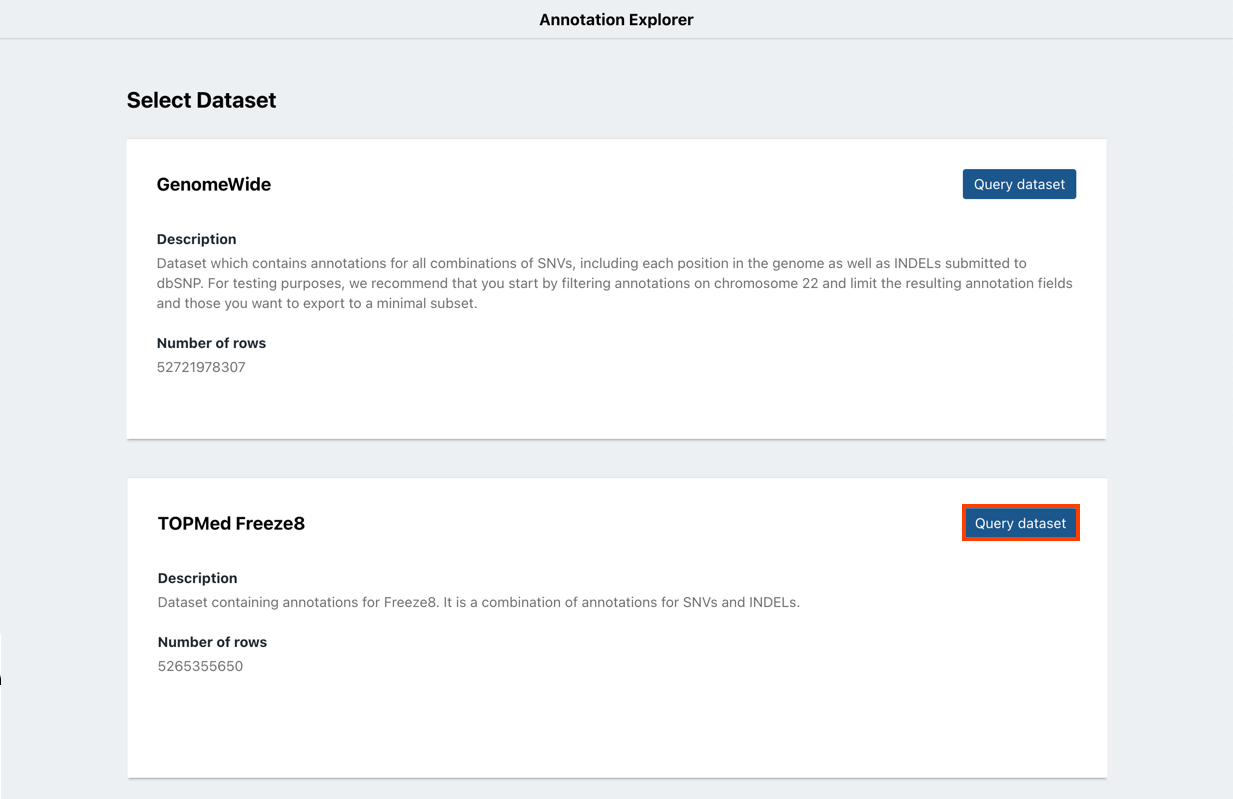
- Click Query dataset next to the dataset you want to query.
- Select the billing group that will be charged for all costs incurred through Annotation Explorer.
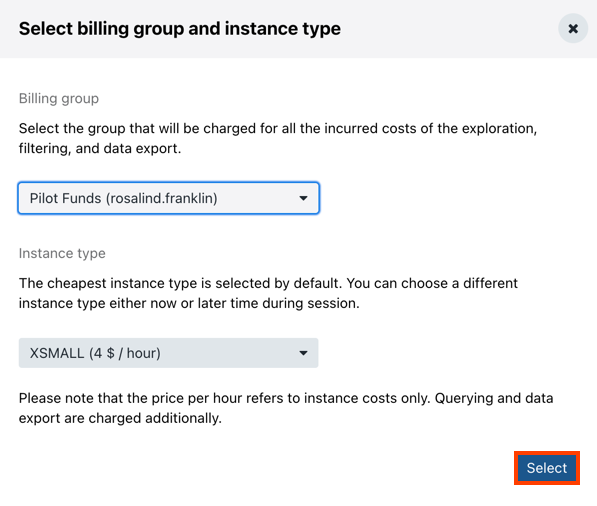
- In the Instance type dropdown, choose the instance you want to use for the exploration. The cheapest instance type is chosen by default.
- Click Select. Annotation Explorer interface is displayed.
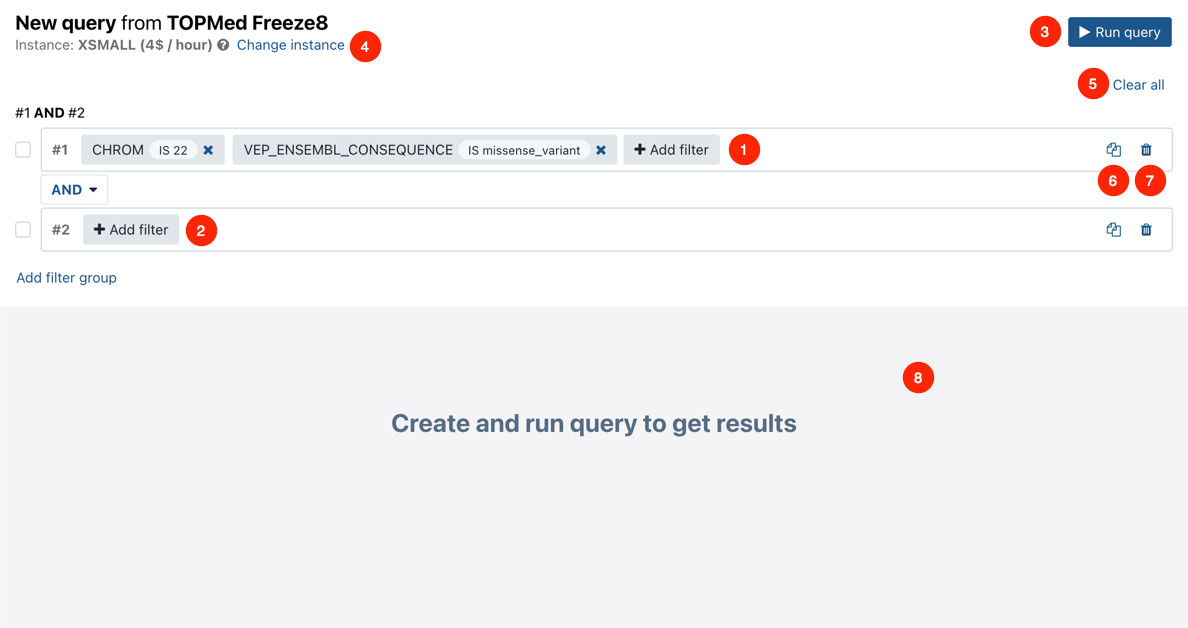
Annotation Explorer interface - quick reference
- Add filter - start adding a filter by selecting fields or searching for a field.
- Add filter group - add a filter group that combines two or more filters using the AND operator between them.
- Run query - run a query based on the defined filters and show the results.
- Change instance - choose a different instance type for your exploration.
- Clear all - clear all filters and start over.
- - copy the filter group if you want to create a minor variation.
- - delete a filter group.
- Query result - shows the query results, one record per table row in the tabular view.
Use the Annotation Explorer
To start filtering data using the Annotation Explorer, follow the steps below:
- Click Add filter to start applying a new filter to the data.
- Select the filtering criterion from the list. Alternatively, start typing the name of the criterion in the search field above to show matching results only.
- Select the filtering operator. Different value types will have different operators available. For example, strings use the "is" or "is not" operators, while numeric types use "equals", "greater than", etc.
- Enter or select the value to filter by. If there is a list of predefined values and the value you want to use is not available, enter it in the field above the list and press Enter.
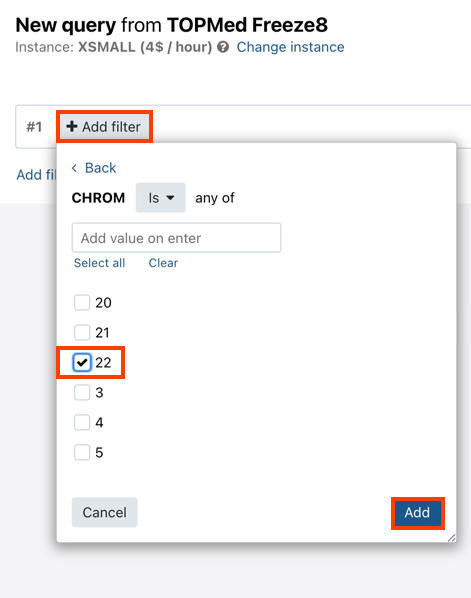
- Click Add to add the filter.
- Optional Click Add filter again to add more filters in the same filter group. Filters in the same group are always linked by the AND operator.
- After defining the desired filters, click Run query. The results are displayed in the lower part of the page.
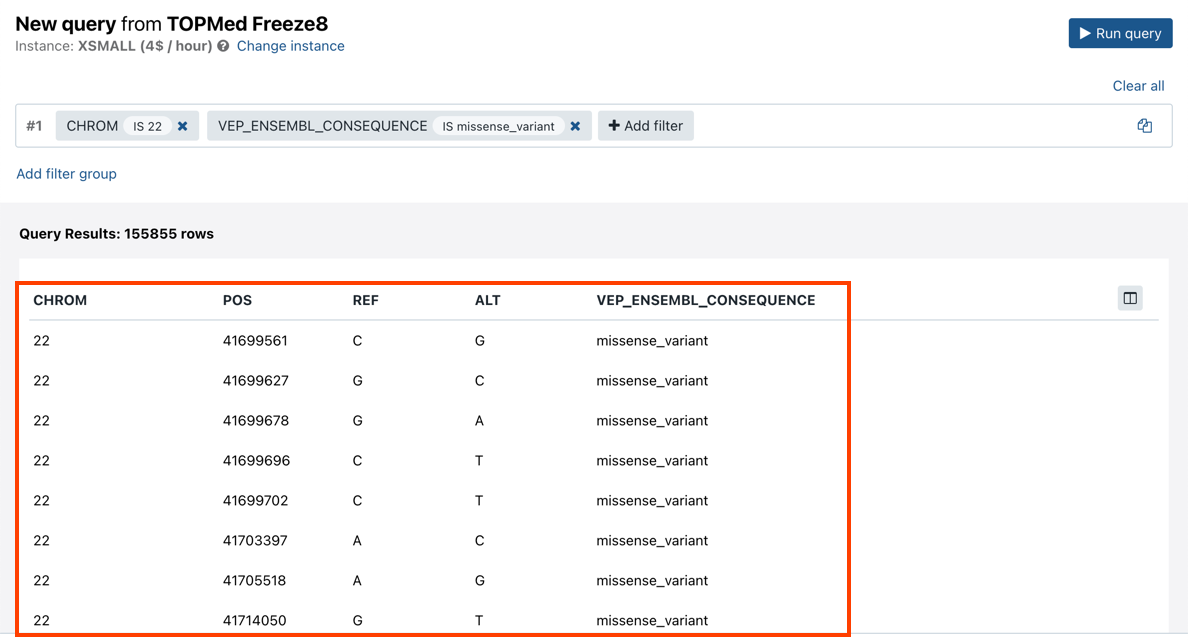
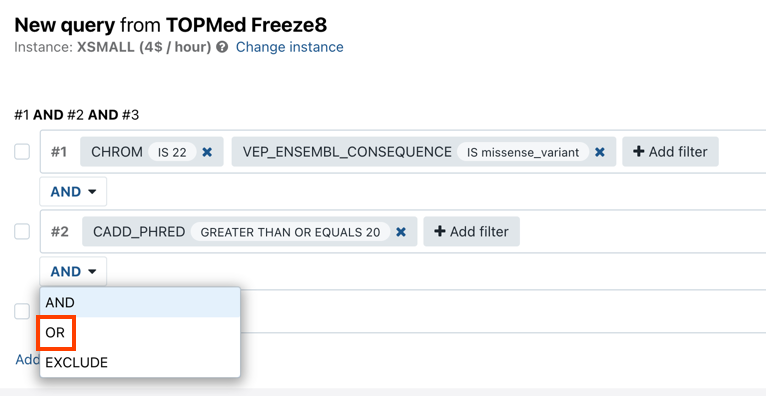
The Annotation Explorer allows you apply more complex filtering criteria by defining filter groups that are linked to each other using one of the available three operators, AND, OR or EXCLUDE. To add a new filter group, follow the steps below:
- Click Add filter group. Tip: click the copy icon to create a copy of the initial filter group. This will speed up creation of the new filter group if it only requires minor modifications compared to an existing one.
- Select the operator that defines the relationship between query groups. Available operators are
AND,ORandEXCLUDE.
- Click Add filter to add filtering parameters in the same way you defined your first filter.
- Once you have defined filter groups, select the checkboxes next to the ones you want to use in a single query.
- Click Group above the query groups list to group them.

- Click Run query. The results will be displayed in the lower part of the page.
Aggregate filtered variants
The Annotation Explorer allows you to aggregate variants and thus increase the statistical power when performing multiple variant association testing.
The following methods for aggregating variants are available:
- aggregate manually
- aggregate using a BED file
Aggregate variants manually
- Define the query as shown in the screenshot below (these criteria are chosen for the purpose of demonstrating the functionality).
- Click Run query.
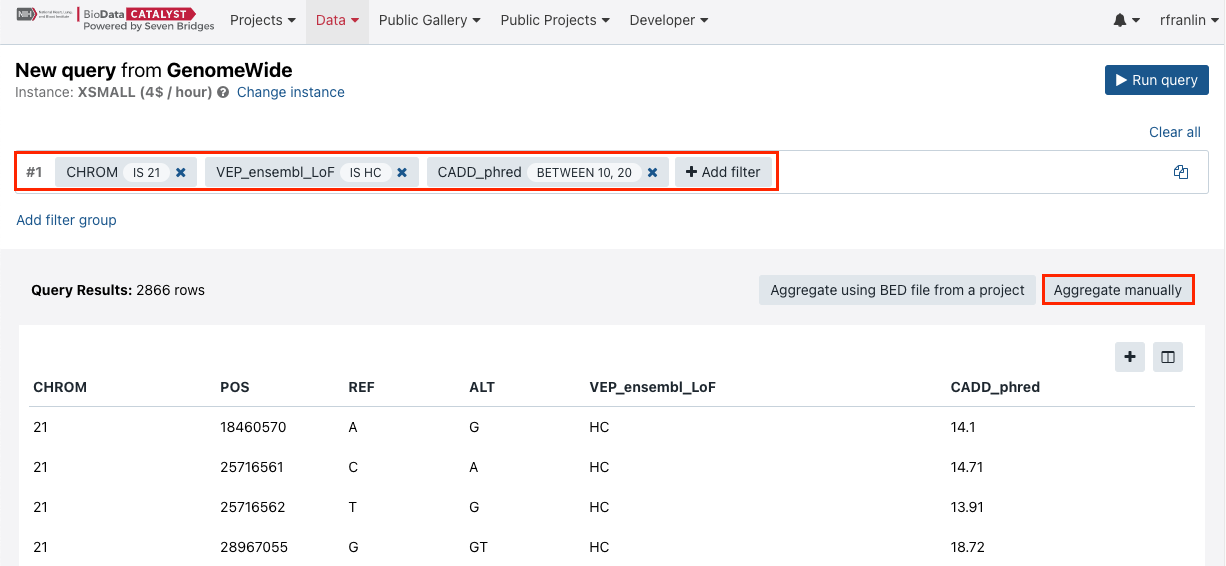
- The query will take some time to complete. Then, click Aggregate manually.
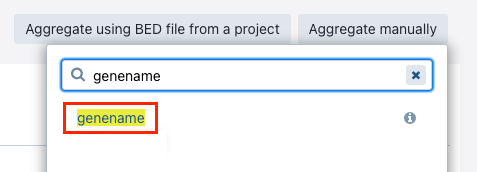
- Enter "genename" as a criteria and click on it. The Annotation Explorer will begin the aggregation and then display the results.
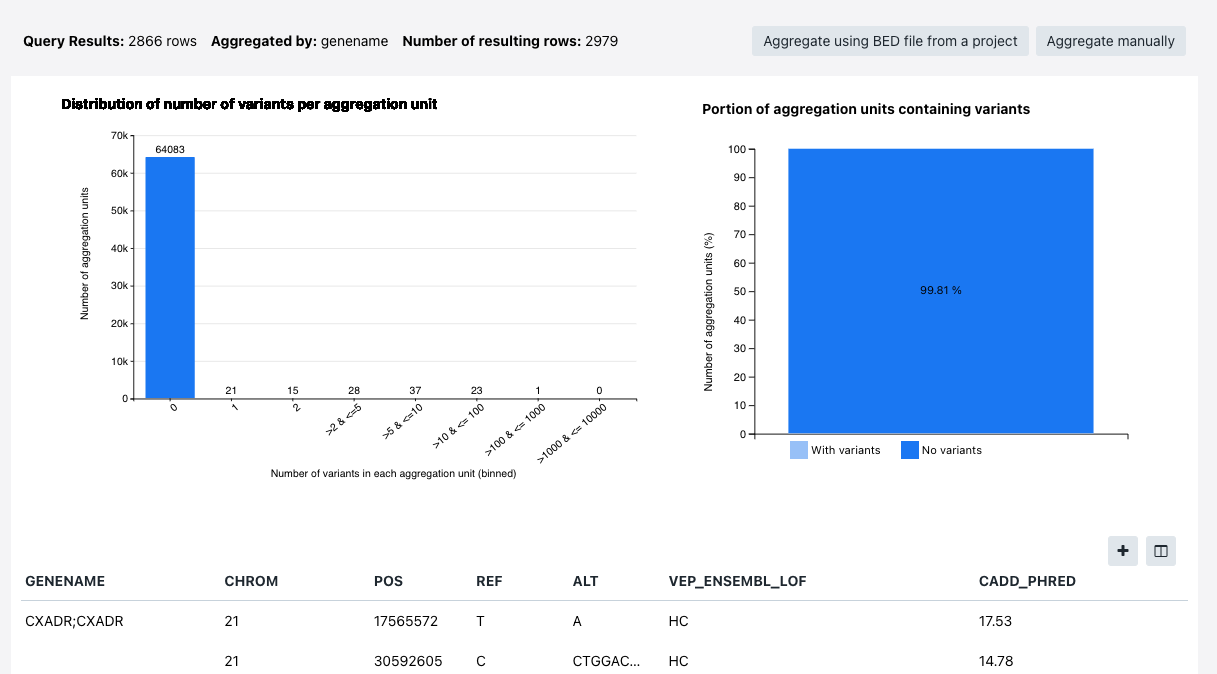
The following information is available:
- Query results - the number of results returned by the query
- Aggregated by - the criteria variants are aggregated by (in the example below "genename")
- Number of resulting rows - how many rows with results is available
- Distribution of number of variants per aggregation unit
- Portion of aggregation units containing variants
Aggregate variants using a BED file
Prerequisite
Before you can aggregate using a BED file, you will have to upload the BED file to your project.
Procedure
- Define the query as shown in the screenshot below (these criteria are chosen for the purpose of demonstrating the functionality).
- Click Run query.
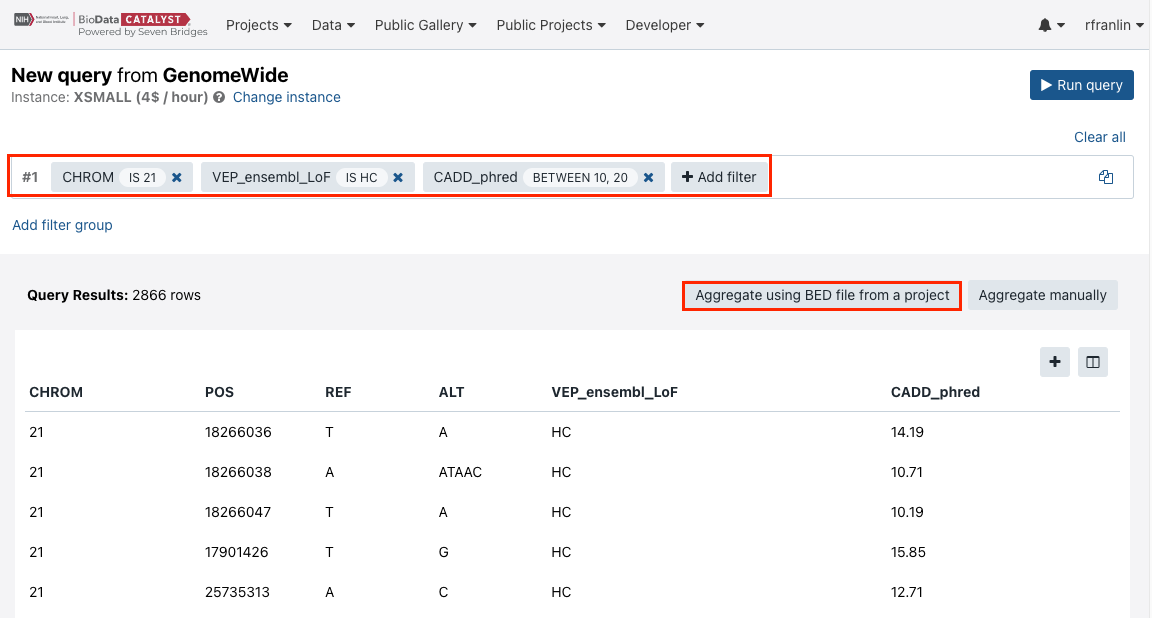
- The query will take some time to complete. Then, click Aggregate using BED file from a project.
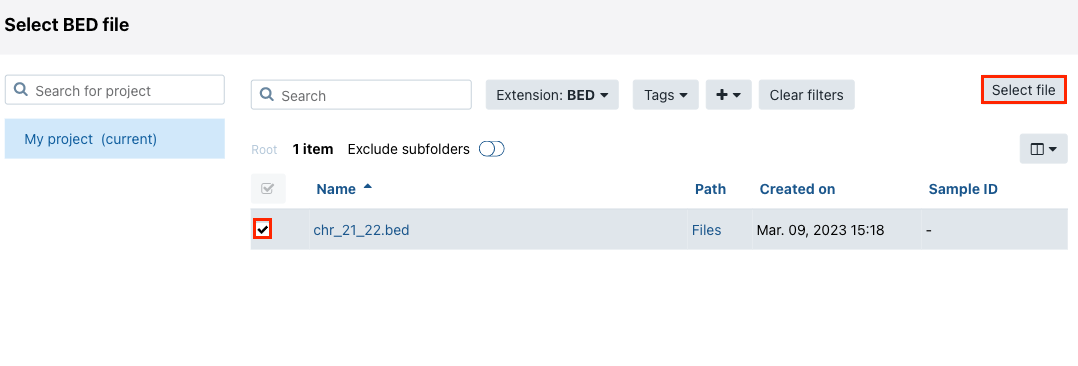
- Choose the BED file and click Select file. The query will start running. Once the query is done, the results will be shown.
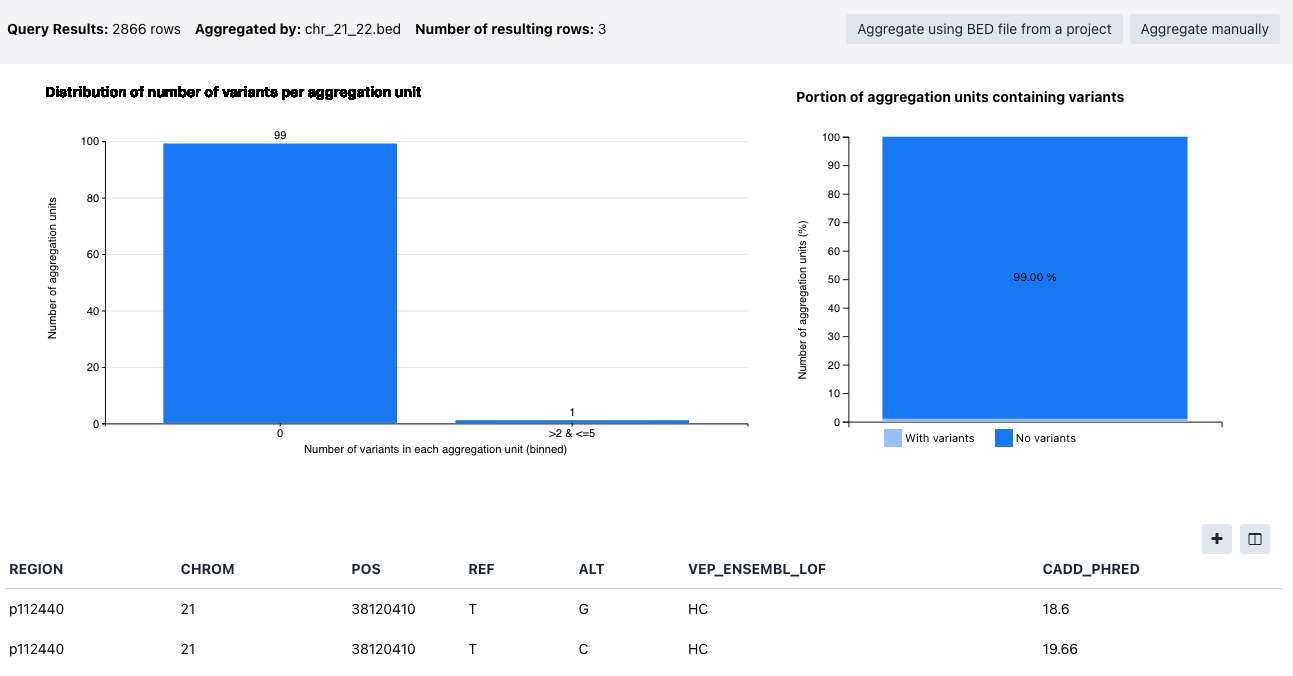
The following information is available:
- Query results - the number of results returned by the query
- Aggregated by - the criteria variants are aggregated by (in the example below "genename")
- Number of resulting rows - how many rows with results is available
- Distribution of number of variants per aggregation unit
- Portion of aggregation units containing variants
Updated almost 3 years ago
